📊 Update: New Informative Reports Page! 📊
We are excited to share that SplitHub has undergone significant updates to both our user interface and server-side operations. These improvements are designed to provide you with better insights and a more seamless experience when running your A/B tests.
What’s New?
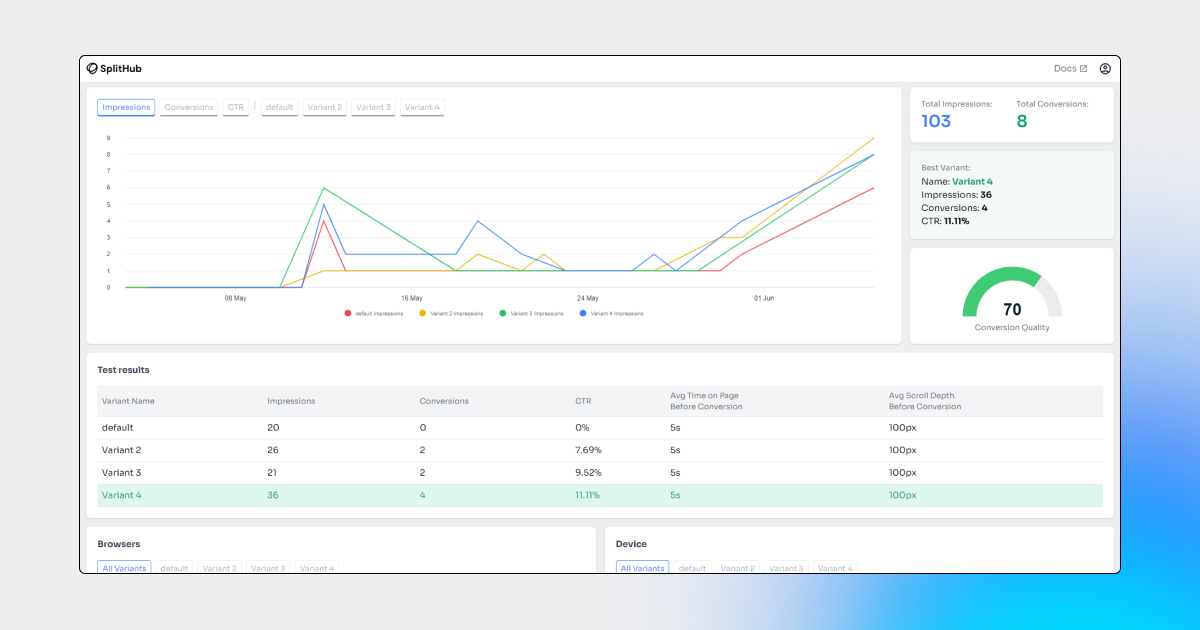
Informative Graphs and Detailed Analysis
Understanding the performance of your A/B tests is now easier than ever. Our new graphs offer a clear visualization of the overall test results and individual variant performance. This means you can quickly see which variants are performing best and make informed decisions based on detailed data analysis.
Enhanced User Interface
The updated UI is not only more intuitive but also packed with new features that make navigating through your tests simpler and more efficient. The streamlined design ensures that you have all the necessary information at your fingertips.
Optimized Backend Performance
We’ve also made significant optimizations to our server-side processes. These changes enhance the speed and reliability of our platform, ensuring that your test data is processed and displayed faster than ever before.
Why These Updates Matter
With these updates, you gain access to:
- Comprehensive Test Insights: Visualize and understand your A/B test results more clearly.
- Variant-Specific Graphs: Drill down into the performance metrics of each variant.
- Faster Processing: Experience quicker data handling and improved platform responsiveness.
How to Get Started
Ready to take advantage of these new features? Check out our updated documentation for detailed instructions on how to integrate and start running your tests with SplitHub.
We are committed to continuously improving SplitHub to meet your needs and help you achieve your testing goals. Thank you for being part of our journey!
Stay tuned for more exciting updates!


